4.3 Anti-Debugging Techniques
With enough time and effort, it can be said that any program can be reverse engineered. Debuggers make it easier to understand program logic, and this applies to malicious software reverse engineers as well. It's better to be safe than sorry - even gentlemen should take tactical measures to increase the difficulty of software reverse engineering, making it as painful as possible for malicious engineers to prevent or delay their understanding of the program's working logic.
To this end, you can take some steps that will make it very difficult for malicious engineers to peek at your program through a debugger.
4.3.1 System Calls
4.3.1.1 Windows
Some operating systems provide special system calls that can indicate whether the current process is executing in debug mode under a debugger. For example, Windows KERNEL32.DLL exports a function called IsDebuggerPresent(). You can wrap a chk() function that uses this system call for checking.
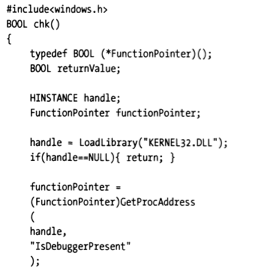
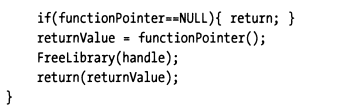
The trick is to call chk() immediately after program startup, letting the check logic execute before reverse engineers can set and execute to breakpoints.
If a debugger is detected debugging the current process, you can force the program to run abnormally or perform some bizarre logic to confuse the person debugging. A debugger is a unique tool because it allows users to observe the program from a neutral perspective. By inserting code like chk, you can force users into a twisted quantum universe where carefully constructed bizarre behaviors and outputs can effectively protect your program from or delay reverse engineering.
4.3.1.2 Linux
On Linux, there are similar methods. You can usually use the "TracePid" attribute in "/proc/self/status" to determine if a debugger is debugging the current process.
Here's an example of checking if the current process is being debugged:
Debugged program:
package main

import "fmt"
import "os"

func main() {
fmt.Println("vim-go, pid: %d", os.Getpid())
}
Debugging operation:
$ dlv debug main.go
dlv> b main.main
dlv> c
dlv> n
dlv> n
dlv> vim-go, pid: 746
Check TracePid:
>cat /proc/746/status | grep TracePid
TracePid: 688
> cat /proc/688/cmdline
dlv debug main.go
Now we can determine that the current process is being debugged by a debugger process with pid=688, and that debugger is dlv.
If you don't want the program to be debugged, you can exit directly when TracePid != 0 is detected. Similarly, this process should be executed as quickly as possible.
4.3.1.3 Other Platforms
Other platforms should also have corresponding solutions. Interested readers can look up relevant information themselves.
It's worth mentioning that in the previous Windows and Linux platform examples, we mentioned that anti-debugging checks should be executed as quickly as possible. In reality, this may not always be achievable. As you'll see in the later examples, when a debugger starts the debugged process, the process will stop at the first instruction, meaning the check and exit haven't been executed immediately. If reverse engineers have strong reverse analysis capabilities, they still have a chance to skip the anti-debugging check logic.
4.3.2 Removing Debug Information
A simple way to make debugging more difficult is to remove debug information from the program. This can be done by stripping debug information (using GNU's strip utility, etc.) or by setting development tools to generate release versions.
Some commercial software companies prefer to strip debug information and accept the performance impact of loading debug information later during diagnosis, because it allows sales engineers to perform on-site diagnosis. When after-sales engineers conduct internal consultations, all they need to do is insert debug information and start the debugger.
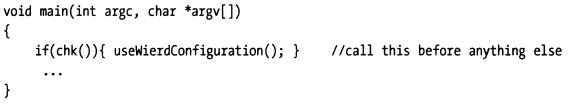
The gcc compiler uses the "-g" option to insert debug symbol information into its generated object code. If this option is not specified, no debug information is output.
If you try to debug it with gdb, gdb will prompt that no debugging symbols are found, making it very difficult for debuggers to understand the program's state and working method.
Lack of debug symbols won't stop everyone. Some decompilers can take machine code and recast it into high-level source code. The good news is that these tools tend to generate poorly readable code.
4.3.3 Code Salting
If memory usage is not a major concern and you don't mind a slight performance impact, one way to prevent debuggers is to periodically add unnecessary statements to the code. You could say this makes it easier for people trying to reverse engineer to get lost.
This way, even if you include debug symbols in your program, it's difficult to understand what's happening (especially if you think every statement has a legitimate purpose).
This way, we achieve our relatively secure goal.
4.3.4 Mixed Memory Models
There are powerful debuggers, such as SoftICE, that can easily switch between user mode and kernel mode. However, few debuggers can jump between two different memory models. Windows is special in this regard. On Windows, this phenomenon is usually called "thunking," which allows 16-bit code and 32-bit code to be mixed.
The following describes the improved technique used in Windows:
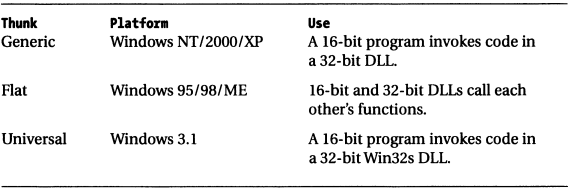
This mixed memory model also increases the difficulty of debugging with debuggers.
4.3.5 Section Summary
While debuggers are indeed good helpers for locating and analyzing problems, in the hands of "bad guys," they can also become tools for attacking normal programs. Therefore, this section also focused on introducing anti-debugging techniques. Anti-debugging techniques are also an important means of preventing reverse analysis and improving security.